Bitcoin
Bitcoin Chart Forms Golden Cross...What's Next for Price?
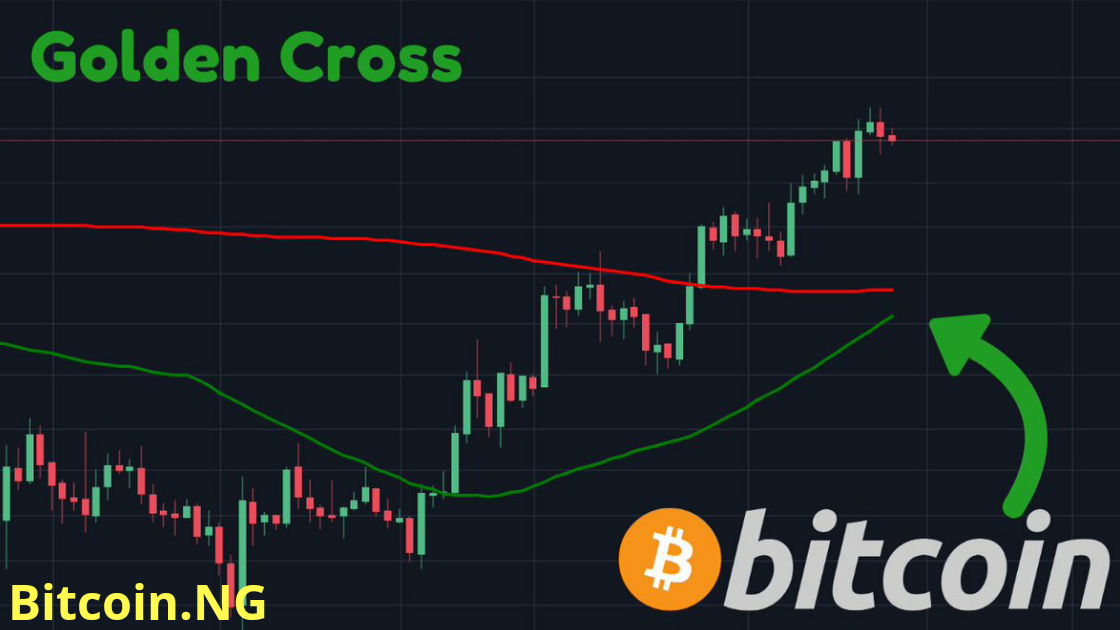
Bitcoin (BTC) price chart just formed a technical pattern known as golden cross; similar to the formation before BTC reached its all-time high of $20,000 in 2017. A “golden cross” occurs when BTC/USD sees its 50-day moving average rise to cross over its 200-day moving average. This current