Bitcoin Chart Forms Golden Cross...What's Next for Price?

Bitcoin (BTC) price chart just formed a technical pattern known as golden cross; similar to the formation before BTC reached its all-time high of $20,000 in 2017.
A “golden cross” occurs when BTC/USD sees its 50-day moving average rise to cross over its 200-day moving average. This current pattern has many traders indicating a possible rally above the $10,000 region.
Just weeks after the third halving in BTC history, the cryptocurrency's price has been trapped between the 9200 - 9700 range after its recovery from a post-halving correction.
Haven struggled to push above the $9900 price point - which remains a critical point for an uptrend to $10,000, Bitcoin has been caught between two paths - break or dip.
The market sentiment at this point is majorly bullish, with some traders highlighting a rally to $10,200, and further closing above that price will push BTC upward to $10,500. Others believe that a dip below the $8900-$8500 support zone will mean a prolonged sideways price action for the rest of the year.
Crypto trader Nunya Bizniz noted:
For the first time during the 2015 lows, there was a golden cross, death cross, golden cross sequence that occurred all within the span of about 100 days. Price then rallied 6,400%. For the 2nd time at 2020 lows, this sequence has again occurred within about 100 days.
Price will..?
Does the Golden Cross Indicate A Certain Bull Run?
With all the hype around the golden cross formation, it is worthy of note that this is the seventh time both moving averages (50 MA & 200 MA) have crossed in Bitcoin's history.
From technical analysis, the above occurrence is usually interpreted as a bullish signal, and an increase in buying pressure should see BTC break upwards.
However, not all golden crosses have triggered a price rally. A notable example was the golden cross of February 2019 which was followed by a strong price drop to $3,750 less than a month after - March 13.
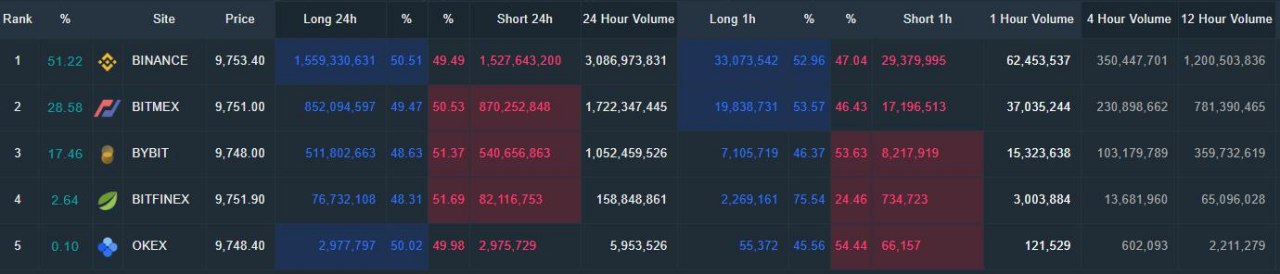
Most Bitcoiners look to pitch more on the bull scenario; a look at the Bitcoin Longs vs Short statistics on exchanges over the past one hour shows that traders have opened more long positions probably in anticipation of a break out.
Price Predictions Moving Forward
For the short term, many traders insist a breakout from the $9,900-$10,000 resistance zone with an equal high volume would see BTC push above $10,071 and then $10,200.
A move towards the 2020 high of $10,500 would further keep the digital asset in a long term position for the confirmation of a new bullish cycle.
In a bearish scenario, where BTC continues to get rejected at the $9,900-$10,000 resistance; these rejections could see price drop to levels $9,600, $8,900-$8,550, and worst case scenario a dip to the $7,438-$7,200 region - if the support levels above do not hold.
NOTE: This publication does not represent investment advice. Opinions expressed here are solely the of the author, not a representation of the views of Bitcoin.NG.
Key insights from Horus Hughes